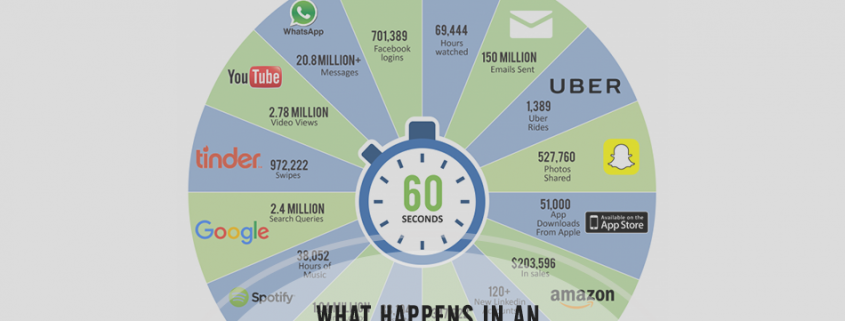
What Happens in an Internet Minute 2016 Infographic
The latest What Happens in an Internet Minute 2016 infographic offers valuable insights into how consumers are using technology to live, work, play, and shop; here’s what small business marketers need to know.
What Happens in an Internet Minute 2016 Infographic and What It Means for Small Business Marketing
In the year 2000, the average attention span of internet users was 12 seconds, today that figure has dropped by one third to a mere 8 seconds. (By the way, goldfish have a longer average attention span than today’s internet user, coming in 13% higher at 9 seconds!) Broken down into 8 second intervals, a minute’s worth of effective internet marketing could be vitally important in helping small business marketers find, attract and convert new customers or represent lost opportunities if done poorly.
Here are some more internet user statistics that show just how difficult it is to capture and keep the attention of today’s buyers when they engage with a brand online:
- Office workers check email 30 times per hour – on average
- 7 minutes is the average amount of time a user spends watching a single video
- 17% of page views last less than 4 seconds
- Only 4 out of every hundred page views last longer than 10 minutes
- Users read 49% of content on web pages with less than 112 words
- Users read 28% of content on web pages of average length (@600 words)
- For each 100 additional words on pages with six hundred words or more, users spend only 4.4 seconds longer on the page
Let’s talk about this topic of web page length a little bit more. While users may read about half of the content on web pages with thin content (111 or fewer words), that’s only about 55 words. By contrast, users read about 166 words – three times as much content – on web pages that have 593 words, which is the average length of all web pages. That said, there is likely to be a declining content consumption rate on web pages with more than 600 words, so paying attention to the quality of content over quantity of content on a web page is the best way to attract and engage site visitors.

Key Marketing Takeaways from the What Happens in an Internet Minute 2016 Infographic
To find key marketing takeaways, we compared Excelacom’s What Happens in an Internet Minute 2016 to the 2015 infographic published last year.
2016 Internet Minute Infographic – Who’s Winning
Uber – Up 100% year over year, with 1389 Uber rides being ordered up in every internet minute (up from 694 in 2015).
Amazon – Sales up 70% year over year per internet minute; growing from $119,760 per minute in 2015 to $203,596 in sales per minute in 2016.
Spotify – Users are listening to nearly three times as many hours of music on Spotify this year compared to last.
App Store (and apps in general) – Last year 47,000 apps were downloaded every minute from the Google Play and Apple App Store combined. This year, 51,000 apps are being downloaded every minute from the Apple App Store alone.
2016 Internet Minute Infographic – Who’s Holding Their Own
LinkedIn – More than 120 new LinkedIn accounts are created every minute, the same as last year.
YouTube – 2.78 million videos are viewed every minute on YouTube, the same as last year.
Google – 2.4 million Google searches happen every minute on the internet, the same as last year.
Vine – 1.04 million Vine video loops play per minute in 2016, the same as last year.
2016 Internet Minute Infographic – Who Lost Ground
Twitter – 200,000 fewer new Tweets happen every minute on Twitter now compared to a year ago: 347k compared to 547k in 2015, a drop of more than one third.
Email – 25% fewer emails are being sent every internet minute in 2016 – 150 million – compared to 204 million per minute last year.
Instagram – There are 70% fewer posts being added to Instagram every minute this year compared to last; dropping from 123,060 posts per minute to just 38,194.
Internet Minute 2016 Infographic – Trends and Takeaways
Social Brands Can Fall as Fast as They Rise
With both Twitter and Instagram showing vulnerabilities, it’s important to remember that customers defect for many reasons. From aging out to losing interest to moving on new social media stomping grounds, the marketing takeaway for any business is that engagement is as much art as science. Today’s buyers will move on if they feel they’ve seen all a brand has to offer.
Conventional Wisdom Isn’t Always Smart
Email was declared dead more than a decade ago and many times since; however, it continues to hold the top spot as most effective and best return on cost for customer attraction and sales with both B2B and B2C marketers. Likewise, some experts have also predicted the demise of social brands like LinkedIn and Facebook, but both are still alive and well.
Regardless of expert or even public opinion, it’s important for marketers to know where their ideal client types are actively engaging with brands online. Even if a social network or app is not widely popular, it might still be popular and effective in reaching particular segments of a brand’s target markets.
Multi-Sensory Content Pays Off
Brands that provide digital content that triggers intellectual, auditory and visual user interest (music, videos, images, and other interactive content like quizzes and forms) keep site visitors and app users engaged longer, giving themselves a better chance of building brand awareness and moving a prospect through the buying journey.


